


30: 11/12/21 Watchlist Update; Adding Fastenal (FAST)


Below you’ll find an updated Watchlist and excerpts from the full 18-page analysis of Fastenal that went out to paid subscribers earlier this week.
Here’s the latest watchlist (click to see Google Sheet):

Fastenal
(Ticker: FAST | Disclosure: None)
Fastenal presents another fascinating case study of a business strategy of moving toward greater capital intensity and earning higher returns on capital as a result.
Like Old Dominion (Ticker: ODFL | Disclosure: None) (see Issue #8), FAST deals with physical goods—in this case as an industrial distributor not just a freight service. FAST’s business is all about getting a lot of things to a lot of places efficiently and quickly (I resisted the obvious fast pun).
Also like ODFL, FAST made the decision to embrace capital intensity early in its existence. Recent technological advances have acted as a tailwind to help the company earn higher margins and better serve its customers.
FAST’s returns on capital have drifted downward as the business matured. But it still earns enviable pre-tax returns in the mid-30s. While FAST does not have the same runway as it did a decade or two ago, it’s still a business I’d like to own at the right price. That makes FAST the latest addition to the Watchlist.
A Different (And Better) Operating Model:
FAST’s strategy of putting its people and products as close to the customer stands out when comparing the company to its peers. Fastenal has more branches and more employees relative to each of the three primary public competitors listed above. Not surprisingly this causes lower revenues per employee. Capital intensity is higher too as can be seen in inventory days and cash conversion cycle. What does FAST get for all of this? Disproportionately higher operating margins and superior returns on capital. Interrelated to all of this is the fact that FAST has happier customers because it controls its own distribution, and that distribution is closer to the customer.

Key Variables / Metrics:
One could probably view most industrial distributors through the simple lens of revenues, capital intensity and margins. Incremental revenue growth accompanied by satisfactory returns on capital tell you management is doing its job expanding the business profitably. Any changes in ROIC can be explained by capital intensity and margins.
Key metric #1: What is the total and mix of in-market locations?
This metric gives a sense for the scope and density of operations. It tells you how close the distributor is to their customers. It’s not a perfect stand-alone indicator. But it does give a sense of a distributor’s chosen strategic path and history. FAST has emphasized 1) lots of locations close to customers (i.e., high branch count strategy) and 2) beginning in 2014, an emphasis on getting even closer to customers via Onsite locations.
A straight branch count has other limitations such as geographic dispersion. For example, at FAST, 84% of public branches and 83% of Onsite locations were in the United States at FYE 2020. But that’s a decision on strategy reflected elsewhere in the financials including margins/capital intensity below.

Key metric #2: How capital intensive is the business?
Key metric #3: What are operating margins (EBIT)?
I include both under one section because there are a lot of ways in which they interact. The company’s decision to build branches close to customers and to incorporate an owned fleet of trucks for distribution vs. outsourcing will increase capital intensity but also improve margins. A big driver of capital intensity is inventory. Industry competitors reliant on third-party distribution can reduce inventory days. But this usually comes at the expense of delivery speed and margin.
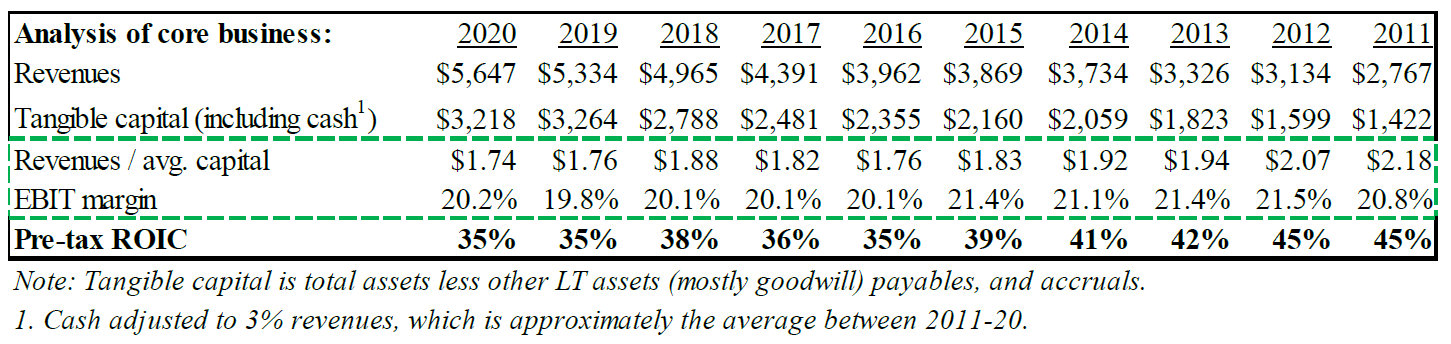
With FAST, the first thing I noticed in the table above was the significant decline in returns on capital over the period. Operating margins have remained remarkably consistent. Given this two-pronged approach the only culprit is capital intensity, as shown in revenues/average capital (lower = higher capital intensity and vice versa).

The full analysis of Fastenal, including my valuation model, is reserved for paid subscribers.
Not sure what to expect from the full version of Watchlist Investing? Check out some sample issues.
For less than $0.55 per day, you can gain access to 10-12 issues per year and full access to the growing archives of analysis. Just one idea could pay for a decade’s worth of subscriptions.
Stay rational! —Adam

