81: Watchlist Update: Adding Home Depot & Lowe's
The two home improvement giants are worth a look.
You’re reading the weekly free version of Watchlist Investing. If you’re not already subscribed, click here to join 1,500 others.
Want more in-depth and focused analysis on good businesses? Check out some sample issues of Watchlist Investing Deep Dives.
For less than $17/month, you can join corporate executives, professional money managers, and students of value investing receiving 10-12 issues per year. In addition, you’ll gain access to the growing archives.
Home Depot & Lowe’s
INDUSTRY OVERVIEW:
According to HD and LOW the home improvement market is $900 billion annually in North America. One source put the US market, the primary market of each company, at $538 billion.
HD splits the $900 billion figure into two $450 billion categories for consumers and professionals, with professionals further broken down to show the $100 billion maintenance, repair, and operations (MRO) market. HD is more heavily weighted toward sales to professionals with 45% of 2021 revenues vs. 20% to 25% for LOW.[1]
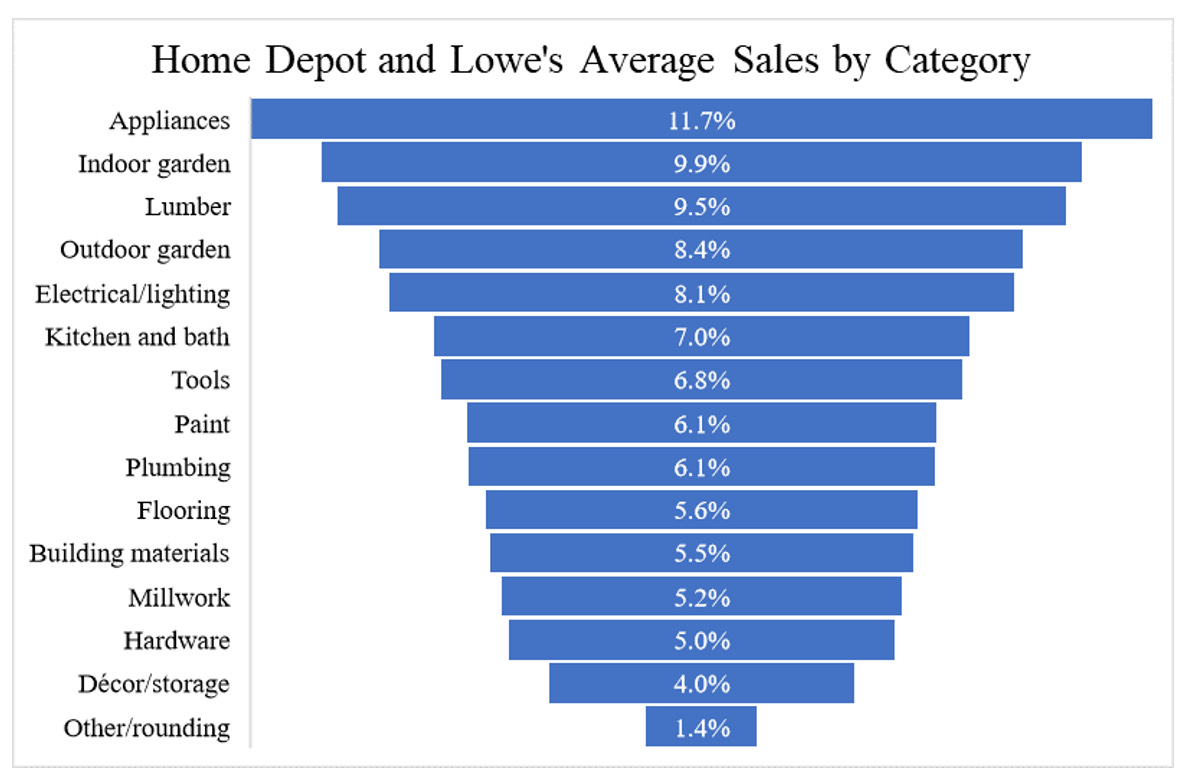
A breakdown of sales of the two companies provides a good idea for the types of markets and products contained under the simple heading of home improvement.
HD’s 2021 revenues of $151 billion give it a 17% share of the $900 billion North American market. LOW’s revenues of $96 billion put its share at 11%. Their combined market share of 28% clearly represents a massive presence, although I’d hesitate to call them a duopoly. The market is so large and consists of so many niche areas that supply building materials, lumber, electrical components, plumbing, paint, home décor, etc. that dominating it completely would be impossible.
HD and LOW compete against local outfits, many of whom serve their markets under the ACE Hardware brand, a cooperative that, as of this writing boasted worldwide sales of $8.6 billion and over 4,600 US locations. That HD moves $151 billion through its 2,300 stores illustrates the huge volumes that go through its locations.[2]
…
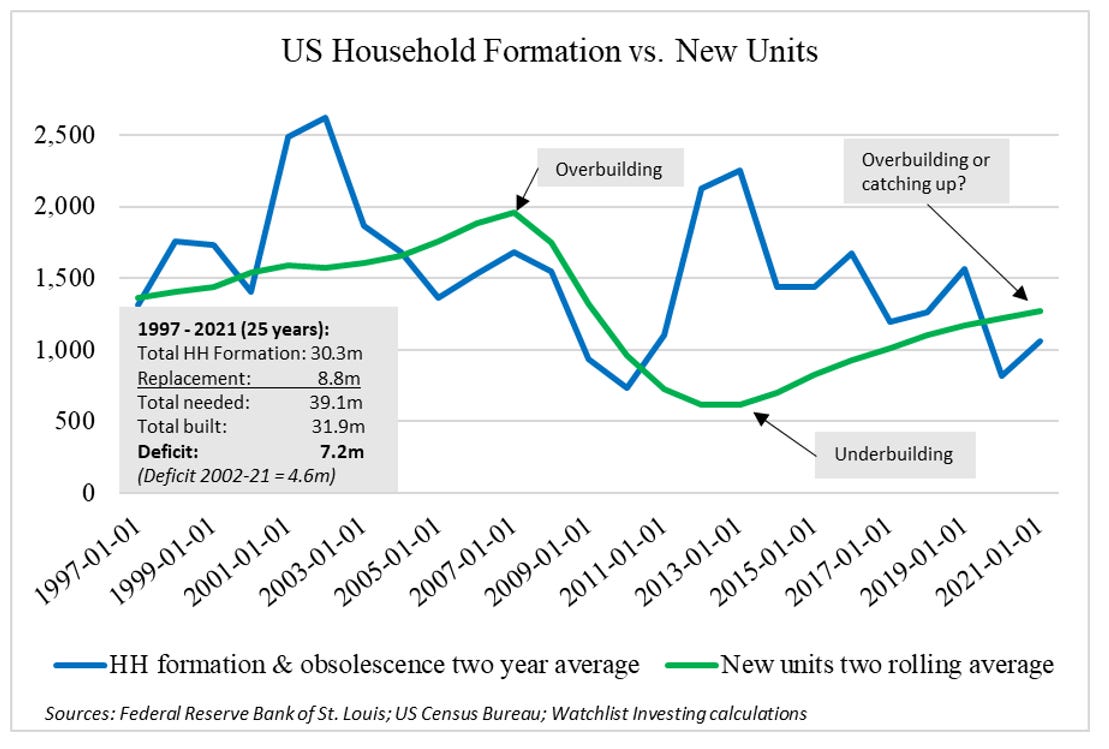
An overarching consideration for HD and LOW is the state of the housing market. I’m venturing into macroeconomics here but in general more families and more housing units mean more revenues for home improvement retailers. I took some time to understand where things stood on this front in the United States and largely came to the same conclusion and same figures as the business press. In short, the US needs to build something like a minimum of four to five million more homes to meet the demand caused by household formation and to replace the roughly 375,000 homes lost each year due to natural disasters or obsolescence.
Another consideration I see is the average size of US homes. From 2015 to 2020 the median single-family home size declined by 8.5% to 2,261 SF. Again, putting on my macro hat complete with fogged-up goggles (in other words, don’t trust me completely on this), I could envision the trend continuing with today’s inflation and impaired consumer purchasing power. A housing stock with smaller living areas would, all things being equal, reduce ongoing demand for everything from lumber to drywall to paint to carpet, etc. I’ll chalk it up as interesting and a possible headwind for the industry but leave you to decide its relative importance to the investment thesis.
KEY VARIABLES-METRICS:
There are loads of data on HD and LOW. Sales per square foot, same-store sales growth, customer transaction count, average ticket price, the list goes on. I include a lot of this data in the appendices, and it is instructive in proper context. What those data lack, however, is capital turnover. Sales/SF can be affected by selling prices, which could come with lower margins or slower turns, for example. Transaction count and average ticket price could be skewed higher by location density as the ubiquity of locations lowers the time penalty for misjudging what’s needed on the job site.[1] Even store count or total retail area doesn’t (to me) seem to top the list, though they are important.
It seems to me the true key metrics are few and that revenues, capital turnover (revenues divided by average capital), and margins will work very well to understand these companies.
As seen below, HD leads LOW in both capital turnover and EBIT margins, though LOW has improved turnover to meet HD. HD still maintains a 2.6 point lead over LOW in term of margin. Turning this over 3x leads to HD’s superior pre-tax ROIC advantage of 7.8 points. The question of how and why HD has its lead is taken up next.
Subscribers gain access to the full, 23-page deep dive featuring ten years of financials, analysis of capital allocation, valuation of both companies, discussion of management/ownership and governance, and more.
Stay rational! —Adam


I don't see the ROIC chart/table of HD and LOW