As a Watchlist Investing Paid Subscriber, you’ll join corporate executives, professional money managers, and students of value investing receiving deep dives, updates on Watchlist companies, and more. Other benefits include access to a live Berkshire Hathaway sum-of-the-parts valuation model, private subscriber-only Google Meetups, and subscriber introductions. All paid subscribers have access to the entire catalog of back issues/posts.
Disclosure: Long HIFS.
The Great Slog
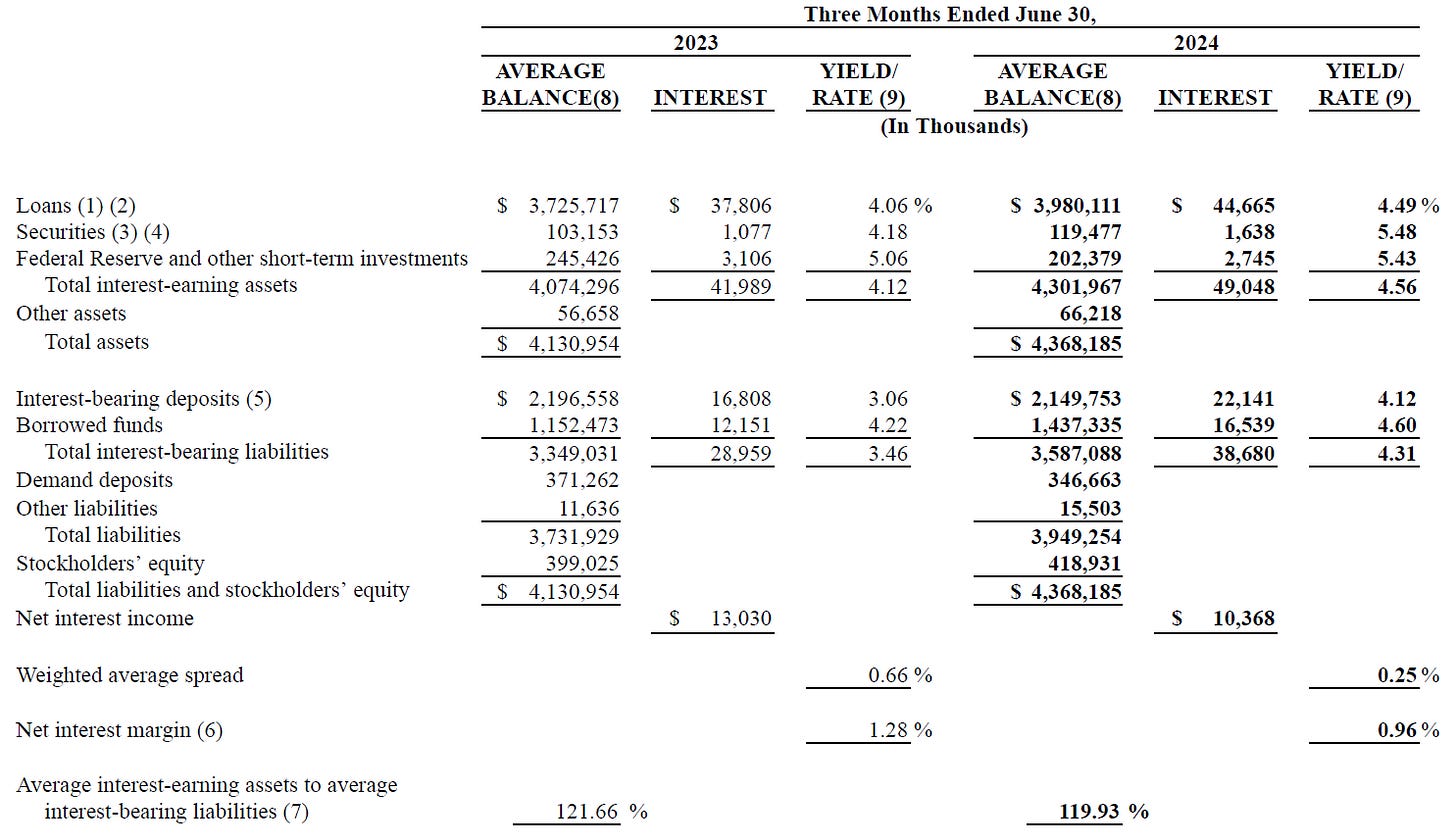
Hingham reported its first quarter of net interest margin expansion in three years. NIM rose from 0.85% in Q1 to 0.98% in Q2. It’s been a slog and will continue to be for some time as yields on existing assets reprice and new assets enter the mix. Lower funding costs will help but aren’t required for the bank to regain a satisfactory level of profitability.
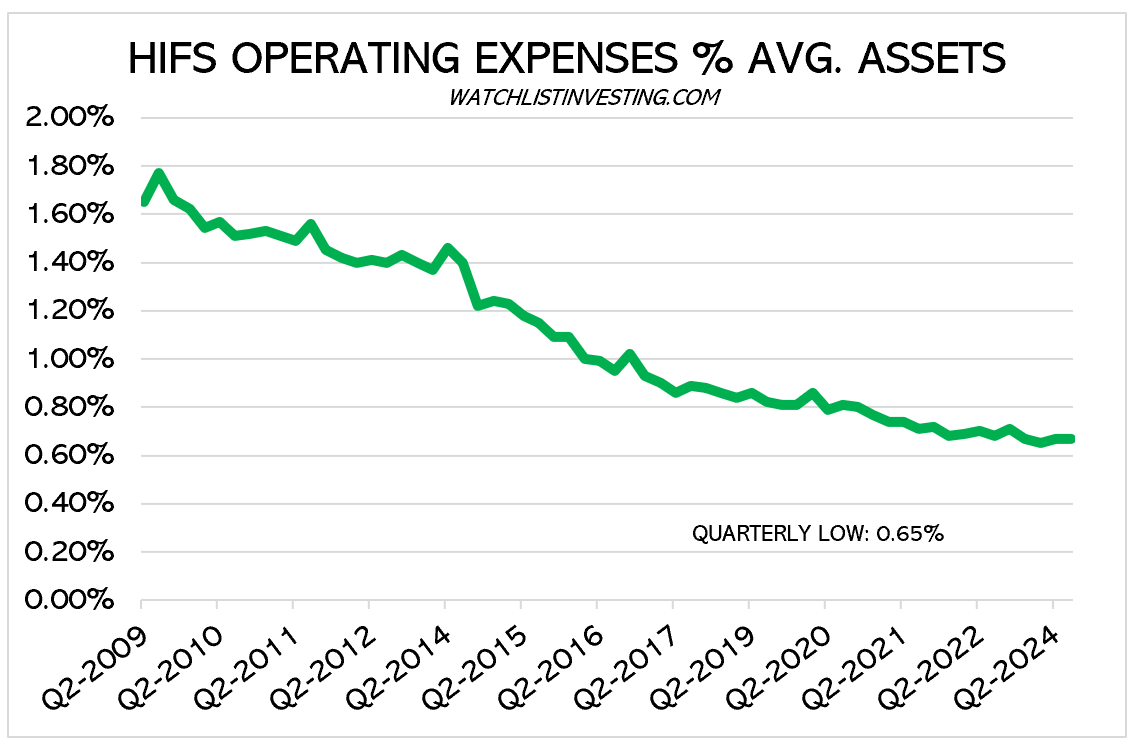
That the bank has remained profitable is a testament to its rock-bottom operating costs.
But I’m getting a little ahead of myself. Let’s take a step back.
Basic Banking Formula
I find it helpful to view bank results through a simple lens of how banks make money:
Yield on Assets minus Cost of Funding = Return on Assets times Leverage = Return On Equity
We can see in the chart above that yields on earning assets improved compared to the same quarter in 2023. This was a direct result of new market-rate loans and repricing of existing loans. Additionally, the bank had higher loan balances.
Below is a breakdown of loan originations and balances by geography. Keep in mind that loans a) periodically amortize their principal and b) sometimes pay down or off in the normal course of business.
Keep reading with a 7-day free trial
Subscribe to Watchlist Investing to keep reading this post and get 7 days of free access to the full post archives.


