


Deep Dive: Hingham Institution For Savings ($HIFS)
Perhaps a once-in-a-generation entry point.

Editorial Note: I started Watchlist Investing three years ago in March 2021. At the time I decided to build a website and delivery system of my own. I did this to avoid Substack’s fee and because I liked locking things down in a PDF. Now I think Substack can deliver a better customer experience for readers and save me time that I can invest in more research/writing — that’s the current hypothesis anyway. This month I’m testing a Substack-first Deep Dive, coincidentally with Hingham Savings, the company that led off this whole adventure. I’d be very grateful for your feedback, both positive and negative (especially negative). Hit reply and let me know. Thank you!
Disclosure: Long HIFS.
Here’s what we’ll cover:
Industry Overview & Business Model
Company History
Key Variables / Metrics
Financial Statement Analysis
Capital Allocation
Management / Ownership
Valuation
Risks
Summary / Conclusion
Appendices / Financials
Industry Overview & Business Model
At its heart, a bank is very simple. Its returns come down to what its assets earn, how much its liabilities cost, and how much leverage it employs.1 This simplified version passes over the many different ways banks operate.
Some banks employ a branching-heavy strategy that creates a very low cost of deposits (think Wells Fargo and Bank of America) but also comes with the overhead costs of staffing and maintaining those branches.
Some banks take another extreme and operate with no branches at all. Beal Bank is a good example of this strategy, for a long time funding itself almost entirely with wholesale funding and brokered CDs.
On the asset side, some banks choose to take little credit risk and only put low loan-to-value secured mortgages on the books, while others lend to risky subprime auto or credit card customers. Some banks stick to basic plain-vanilla lending while others have trust and wealth departments, insurance arms, etc.
The bottom line is that banks come in many different shapes, sizes, and operating philosophies. The key to success in banking is the same as it is in investing — staying within your circle of competence.
Banking in the United States
The banking business in the United States is huge. Hingham’s $2.4 billion in deposits pale in comparison to the roughly $17.4 trillion in US banks today.2 The term monopolistic competition certainly applies here. Smaller participants like Hingham are market takers who buy money at one price (paying interest on deposits) and sell it to others (lending to consumers and/or businesses). Even industry behemoths JP Morgan, Bank of America, Wells Fargo, Citigroup, and US Bank, with half of all banking assets in the United States, have questionable influence on the market price for money. The key, then, is operating efficiently and having loan losses appropriate to the types of credits being underwritten, something Hingham does very well.
Hingham’s Markets
The Bank continues to believe that the most attractive markets for its business are coastal, urban, gateway cities with substantial wealth, favorable demographics, substantial multifamily real estate, and consolidation among small and mid-sized banks. - 2023 10K
The quote above speaks to Hingham’s chosen strategy of expanding beyond its home base of Greater Boston to Washington, D.C. (2016), and the San Francisco Bay Area (2021). These markets might seem unconnected at first but they all share the attributes above. While not without risk, these expansions followed a logic that allowed growth to remain within a segment of the banking market it knew well just outside of its home geography. It viewed this as favorable to expanding to adjacent services within Boston.
This is perhaps my favorite slide included every year during the bank’s annual meeting presentation:
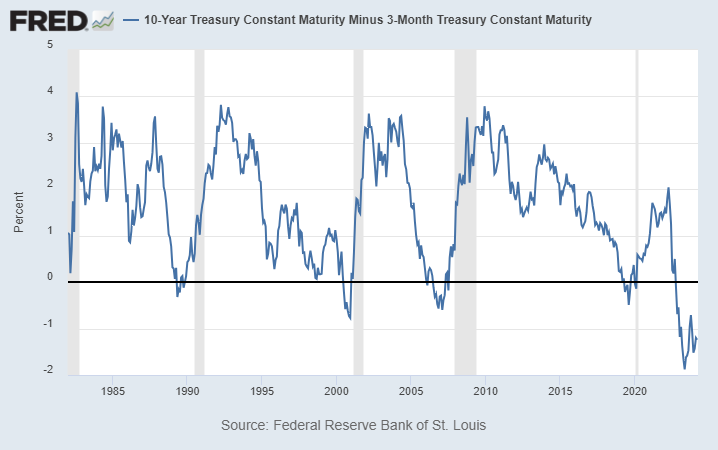
“Normal” Banking
Most operating conditions feature a normal yield curve in which short-term rates are lower than long-term rates, reflecting the inherent risk and time value of money considerations for longer-dated maturities. Occasionally, the yield curve inverts, often right before a recession. Today’s situation featuring a historically long and deep inversion is unusual.
The 3-10 split, or the 10-year Treasury minus the 3-month Treasury, went negative in late October 2022. It hit a low of -1.89% in May 2023 and remains at -1.26% as of late March 2024.

Company History
The history of Hingham Institution for Savings dates back to 1834, making it one of America’s oldest banks. At the time of its founding Hingham, Massachusetts was a town of 3,500 residents—twice the size of Chicago. Its very first loan, made in 1835, was a $400 real estate loan at 6%. One of the bank’s first customers was Daniel Webster. The bank financed an expansion of Webster’s farm into Marshfield, Mass.
Promissory note from Daniel Webster (reproduced).

Source: Company website.
In December 1988, the bank converted from a mutual bank to a stock bank. The conversion brought $9.6 million of capital into the bank, a portion of which was used to purchase the building next door to its main office, which was to house its lending department.
Things were already heading south when the bank went public. The bank found itself with a growing amount of non-performing loans, lost $8 million between 1989 and 1991, and topped off with a Memorandum of Understanding (MOU) from the FDIC. The former president of the bank, Wilfred Creighton, was found to have engaged in numerous instances of bank fraud, including kickbacks. Management was more focused on enriching itself than running even an average-quality bank. It ignored a fruitful lending area in/around Boston and instead made loans outside of its market, including a $5 million loan to a dog racing track.
In 1993, Robert H. Gaughen, Sr., father of current chairman, Robert H. Gaughen, Jr., and a board member with a large personal ownership stake in the bank, waged and won a proxy battle for control of the bank. Out went the bad actors and in came an experienced and prudent banking team.
The dramatic fall and takeover of the bank are a constant reminder to management and shareholders of the risks of taking one’s eye off the ball. HIFS today doesn’t try to mitigate the risk of insider loans, for example, it simply forbids them.
The management philosophy at Hingham today is one of extreme focus. Its lending activities are almost exclusively in real estate, particularly multi-family commercial real estate. It focuses on controlling the two factors banks can control: loan losses and overhead costs.
The Gaughens made the strategic decision to expand into Washington, D.C. (2016), and San Francisco (2021), markets characteristically similar to Boston, rather than pursue loans and banking services within its home area geographically but outside its circle of competence.
Key Variables / Metrics
A well-run bank does two things: It focuses on keeping overhead and loan losses low.3 These are the two primary drivers that feed into return on assets which, coupled with leverage, results in return on equity. And because of that leverage, even small improvements in loan losses and expenses can translate into meaningful incremental returns on equity. Getting loan losses and expenses right means a bank can be a market taker for yield and rate and still generate a good economic return through cycles.
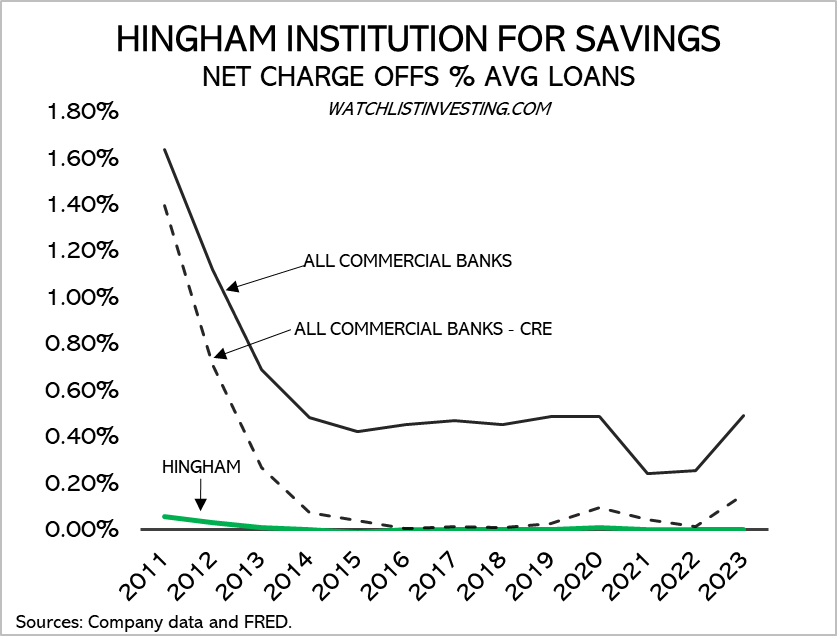
Key Metric #1: Loan losses
Hingham’s underwriting is superb. Its loan loss history barely registers on the graph below. Underwriting mistakes take a few years to come to the surface so it’s important to 1) understand the bank’s philosophy and track record and 2) any changes to the philosophy or in management that might render the historical record obsolete. Hingham has been a steady operator.
Key Metric #2: Overhead
Operating expenses are under the direct control of management. A typical bank, operating with more branches and personnel, operates with about 4x the level of operating expenses as a percentage of assets as Hingham. Hingham’s real estate focus also allows more assets/employee than other business lines.

Key Metric #3: Leverage
I like to measure leverage as average tangible assets / tangible equity. Hingham has become more conservative over the past decade, ending 2023 with leverage of 10.5x. As a general rule banks operate with about 10x leverage, although their asset base impacts the degree of leverage that is prudent/allowed.

Financial Statement Analysis
A long and deep inverted yield curve brought Hingham’s liability-sensitive balance sheet front and center in 2023. Spreads collapsed as funding sources repriced far faster than assets. A slower pace of increase like that seen from 2016-20 allows assets to reprice and new loan growth to cover an increase in funding costs. But when the graph is nearly vertical (see dotted line below), a liability-sensitive bank has nowhere to hide.
Keep reading with a 7-day free trial
Subscribe to Watchlist Investing to keep reading this post and get 7 days of free access to the full post archives.