


Issue 37.1: BRK Q1 2024 Update
Digging into Berkshire's Q1 results and an updated valuation
As a Watchlist Investing Paid Subscriber, you’ll join corporate executives, professional money managers, and students of value investing receiving deep dives, updates on Watchlist companies, and more. Other benefits include access to a live Berkshire Hathaway sum-of-the-parts valuation model, private subscriber-only Google Meetups, and subscriber introductions. All paid subscribers have access to the entire catalog of back issues/posts.
Disclosure: Long BRKB.
Where to begin?
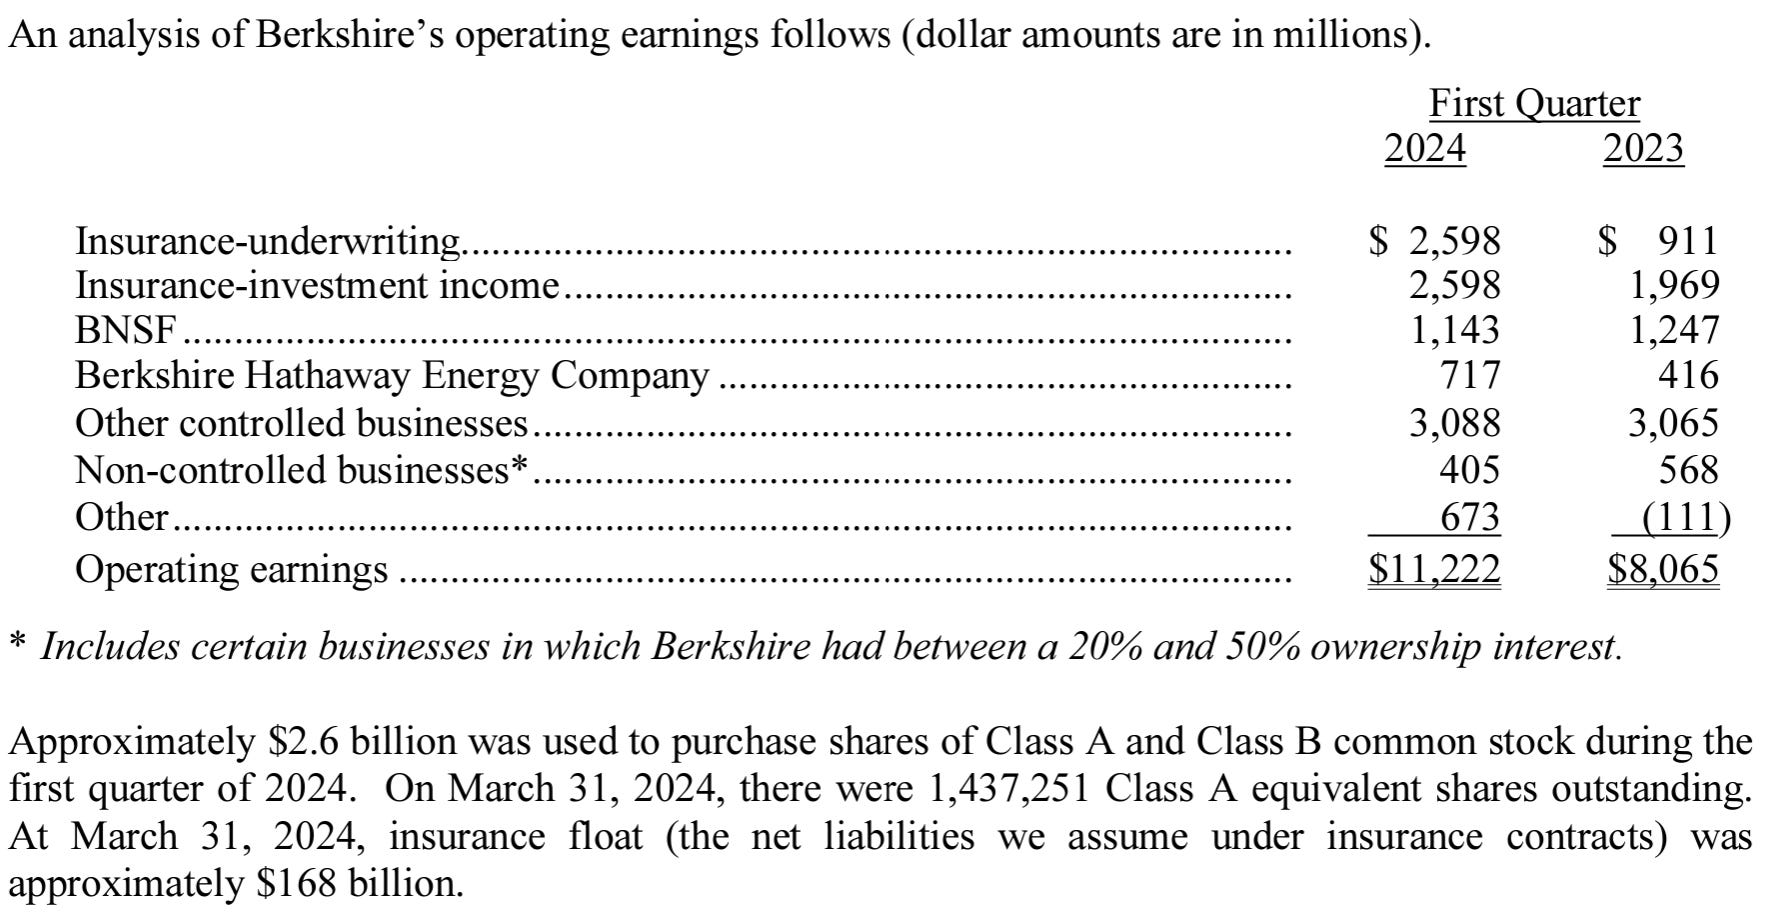
I start my analysis of any given quarter or year at the press release. This (generally two-page) document summarizes Berkshire’s operating earnings1 across its major business lines and provides other useful information.
Additionally, we get an update on share repurchases ($2.6 billion in Q1), shares outstanding, and float ($168 billion at the end of the quarter).
Digging into the 10Q
We find a key piece of information right on the first page. Berkshire lists its shares outstanding as of a few weeks after the end of the quarter, giving us a glimpse into additional share repurchase activity. We see above that there were 1,437,251 Class A equivalent shares as of March 31, and that number fell to 1,436,796 as of April 19, a decrease of 455 Class A shares. Shares traded in the $600,000 to $615,000 range during that time, so we can see Berkshire spent about $275 million repurchasing shares.

Cash Flow Statement
Here we get a sense of Berkshire’s major capital allocation moves during the quarter, which we can sum up as $2 billion growth capex, $17.3 billion net sale of stocks, $3 billion of acquisitions, and $4.6 billion debt repayment.
Cash in was $17.3 billion net sale of stocks plus $11.2 billion operating earnings or $28.5 billion. Cash out from the items above totals $9.6 billion, or a net cash increase of $18.9 billion. This roughly matches what we saw with actual total cash of $167.6 billion on December 31 increasing to $189 billion on March 31, an increase of $21.4 billion (there are other items but we hit the major ones).2
Capex/depreciation: Berkshire spent $4.4 billion in the quarter on capex, which was $1.2 billion above depreciation and amortization. But Berkshire has a fair amount of accounting charges that aren’t true economic charges. On p.13 we see that actual depreciation was $2.4 billion, revealing a healthy $2 billion of growth capex in the quarter (a caveat: depreciation at BNSF understates economic depreciation due to inflation, but we’re close).

Action in stocks: We see Berkshire sold almost $20 billion of equities and bought $2.7 billion, meaning it sold, net, $17.3 billion. On page 11 we find that taxable gains were $14.2 billion.
Acquisitions: Just a tiny (for Berkshire) $327 million of tuck-in acquisitions in Q1 plus another $2.7 billion of money spent buying pieces of businesses Berkshire already owned a majority interest. We know from other disclosures that the bulk of the $2.7 billion is the remainder of Pilot (more on that below).
Debt: Berkshire paid down about $2 billion in long-term debt and repaid another $2.6 billion in short-term borrowings. (On p.19 we learn that in April BRK issued $1.7 billion of Yen-denominated debt at very attractive rates. We also learn that Pilot repaid its 3rd party borrowings with a loan from the insurance group.)


Operating Businesses
Finally, to the meat-and-potatoes of Berkshire, its operating units.
Keep reading with a 7-day free trial
Subscribe to Watchlist Investing to keep reading this post and get 7 days of free access to the full post archives.