


Issue 43: BRK Q3 2024 Update
Digging into Berkshire's Q3 results and an updated valuation (live Google Sheet)

As a Watchlist Investing Paid Subscriber, you’ll join corporate executives, professional money managers, and students of value investing receiving deep dives, updates on Watchlist companies, and more. Other benefits include access to a live Berkshire Hathaway sum-of-the-parts valuation model, private subscriber-only Google Meetups, and subscriber introductions. All paid subscribers have access to the entire catalog of back issues/posts.
Disclosure: Long BRKB.
The Big Picture
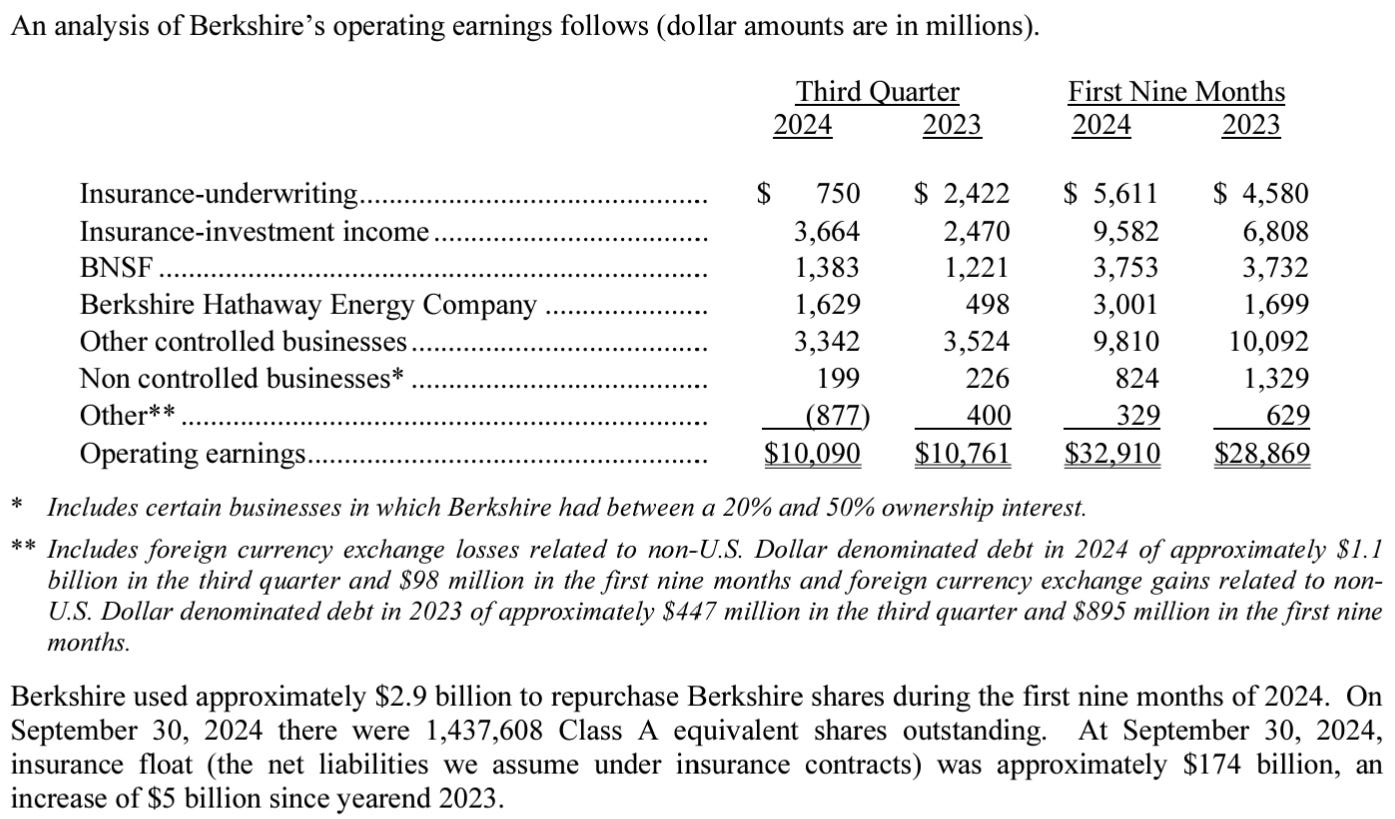
Berkshire packs a lot into its quarterly press releases. In half a page we can see a summary of operating earnings across its major business lines, the amount of share repurchases, shares outstanding, and the quarter-end insurance float.
Operating earnings for Q3 show higher investment income and greater earnings from BNSF and BHE, offset by lower earnings from other wholly-owned businesses and lower insurance underwriting results.
While insurance underwriting results may be way down compared to the same quarter last year, it’s important to remember that even a breakeven result in underwriting gives free use of insurance float, now at a whopping $174 billion.
It’s not surprising that the YTD repurchase number remained flat from Q2, given that shares have traded around their intrinsic value.
Digging Into The 10Q
No surprise to see shares remain unchanged at three weeks into the fourth quarter given Berkshire’s current valuation.
A Whole Lotta Cash
The big story of Q3 is Berkshire’s cash position. At $320 billion excluding rail/energy and $325 billion in total, Berkshire’s cash is at an all-time high in absolute terms and relative to total assets (28%). I recently spoke to the Wall Street Journal about my thoughts, which I’ve elaborated below.
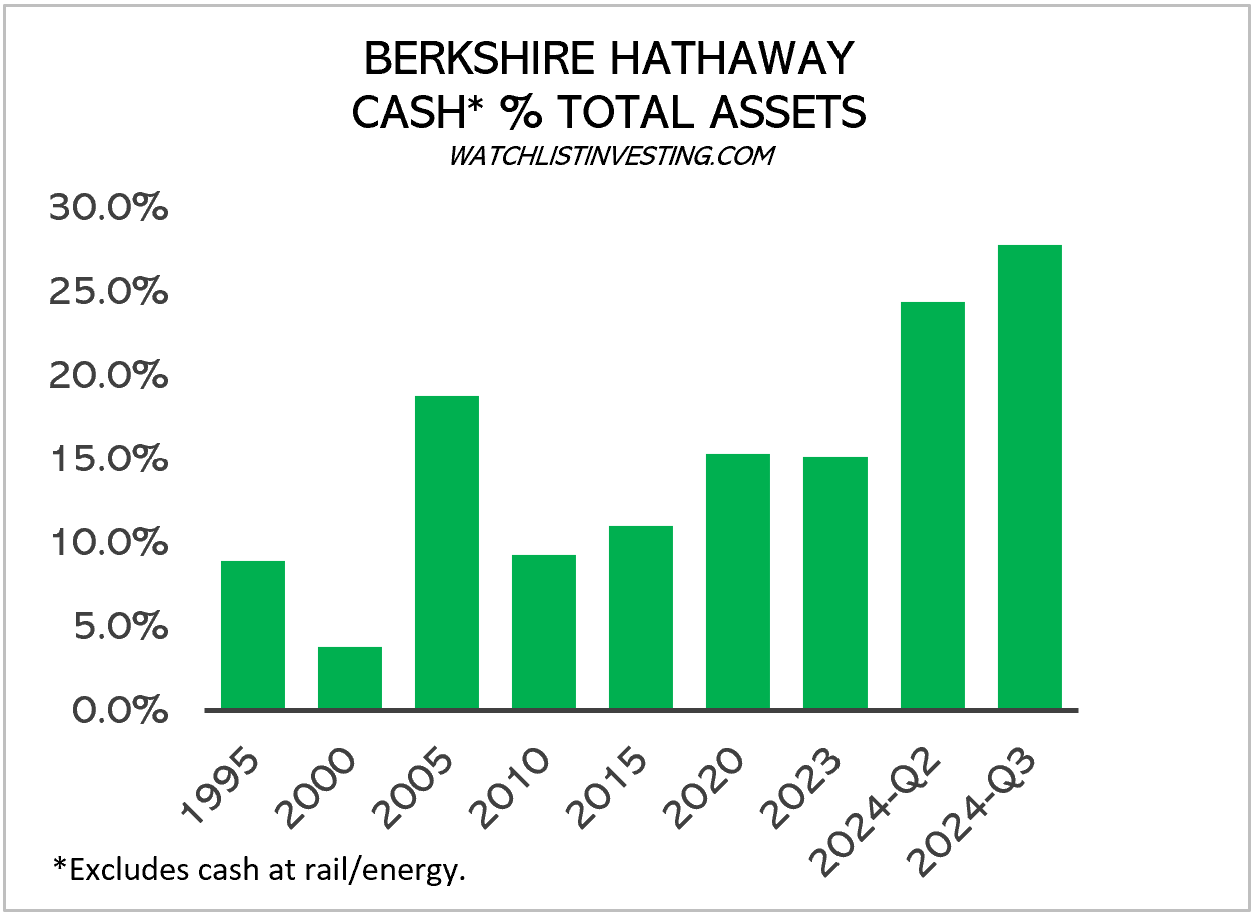
It’s tempting to read into this and conclude that Buffett is timing the market, that it augers a coming crash. While that may well happen — and equity markets certainly don’t look cheap — there are Berkshire-specific considerations to keep in mind, too. Let’s look at why cash is so high and what that might tell us:
Cash as an outcome: Outside of the perhaps $50 billion target to support current insurance operations, cash at Berkshire has always been the result of other processes. Cash ebbs and flows based on Berkshire’s opportunity set at the time. To my knowledge, Buffett has never stockpiled cash in anticipation of a market pullback.
Equity sales: Year-to-date Berkshire reported net sales of equity securities of $127 billion. The bulk of this is Apple and to a lesser extent Bank of America. We can conclude that Apple is expensive and worth trimming. But remember these are only two data points.
Size relative to the market: Berkshire’s size effectively reduces its opportunity set. Berkshire simply can’t put a hundred billion or even tens of billions of dollars to work in smaller companies. Investors working with smaller pools of capital shouldn’t simply toss in the towel because Berkshire isn’t buying — opportunities almost always exist in some corner of the market.
BRKA / BRKB: Berkshire’s stock price is up 30%+ in 2024 and trades around intrinsic value. This cuts off what has been a meaningful capital allocation avenue.
Meanwhile, an astonishing $100 million a week — $35 billion annually — of cash comes into headquarters through operating earnings. Add to that float, which is up $5 billion YTD. While Berkshire waits for capital allocation opportunities to open up it sits patiently in US Treasuries keeping its dry powder safe.
We may well be at the junction of Berkshire needing to pay a dividend. Retaining earnings for half a century and investing that capital at a good clip will cause size to become an anchor. Berkshire will continue to find opportunities to deploy capital in stocks, wholly owned businesses, and its own shares. But these opportunities may be spaced far enough apart to justify a relief valve in the form of a dividend. A modest dividend policy of 25% of operating earnings would be a good start. Even at 50% Berkshire would retain a huge amount of flexibility in capital allocation.

Click here or the image above to apply.
Operating Businesses
Insurance
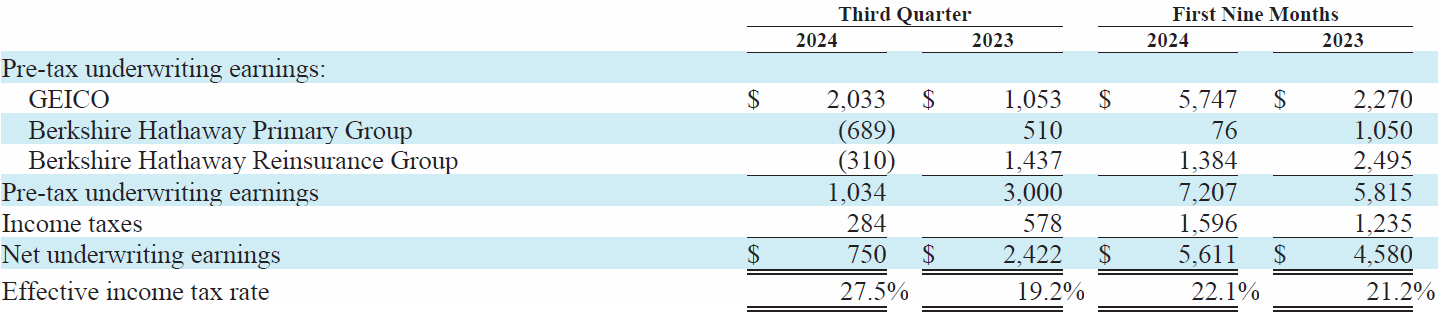
The $1,034 million pre-tax underwriting gain in Q3 is a highly satisfactory result for Berkshire’s insurance operations, representing a pre-tax margin of 4.7%. It is only in comparison to recent quarters that it looks “worse”.

Remember that even a breakeven underwriting result means the now $174 billion of float is free money. Any underwriting margin is simply gravy. Given Berkshire’s history of generating underwriting earnings, my valuation includes a normalized 4% pre-tax margin.
Let’s dig into the important details of each major insurance segment.
GEICO
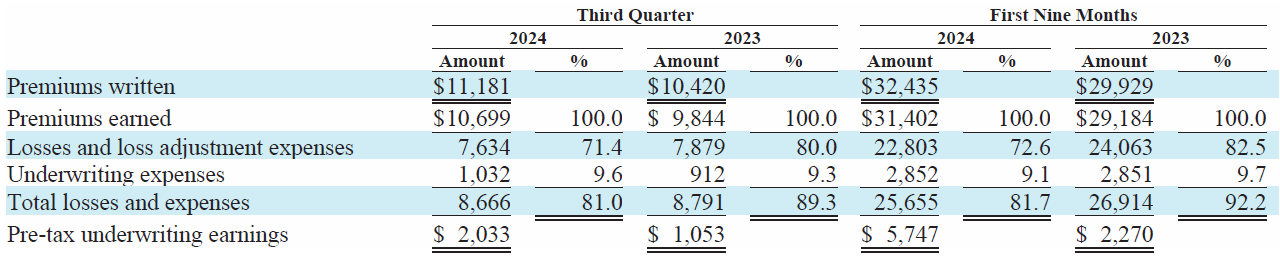
GEICO turned in impressive results in Q3 and seems to be making good progress returning to star status. Its topline growth has been driven by price increases offset by declines in policies-in-force. According to Berkshire, the decline in PIF eased in the second half of the year. The combined ratio of 81% is far above the company’s long-term trend. GEICO should be in the 4% to 5% range. While nice to have $2 billion underwriting profit in a single quarter and $5.8 billion YTD, this level of profitability portends future reductions in premiums per policy.
Primary Group
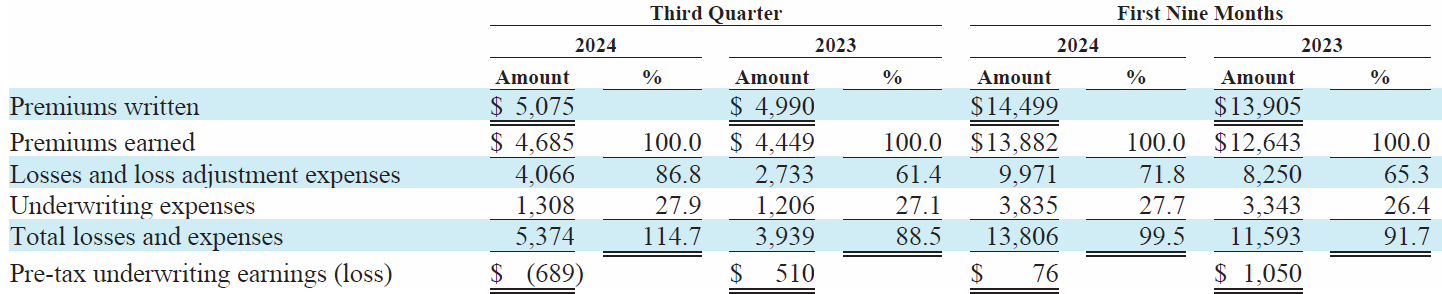
The Primary Group turned in a rare disappointing quarter with an almost 115% combined ratio and an underwriting loss of $689 million. This “single unit” is comprised of numerous individual operating entities, and it was the GUARD unit that caused most of the problems. In another rarity, Berkshire installed new management, which went to work exiting admitted homeowners lines and tightening underwriting standards in other lines.
While small compared to Berkshire’s insurance empire, the experience at GUARD is a cautionary reminder of how quickly results in insurance can change, and how problems can crop up. Losses included $789 million in unfavorable loss development in Q3 alone, most of which was attributable to GUARD. That’s a truly huge number for an entity doing $4.7 billion of earned premiums.
Results in Primary also included $80 million in incurred losses from Hurricane Helene.
Reinsurance
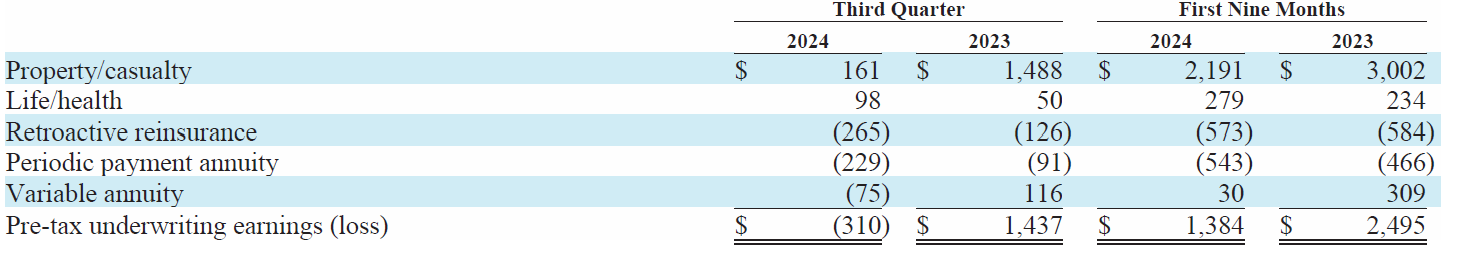
Reinsurance results are necessarily “lumpy”. And what at first glance may seem to be poor results with a pre-tax underwriting loss of $310 million, it’s important to remember the time value of money nature of the retroactive reinsurance and annuity businesses. As an extreme example, the periodic payment annuity business wrote no premiums in all of 2023 and YTD 2024. The loss is from the accretion of discounted liabilities and forex gains/losses.
In the case of the retroactive reinsurance business, it took a hit to the tune of $610 million in the first 9 months of 2024 from amortization of deferred charges booked at the inception of the contracts years ago. These non-cash charges make the reported results look much worse than the economic reality.1
Another plus: the reinsurance group had $1.2 billion of favorable loss development YTD.
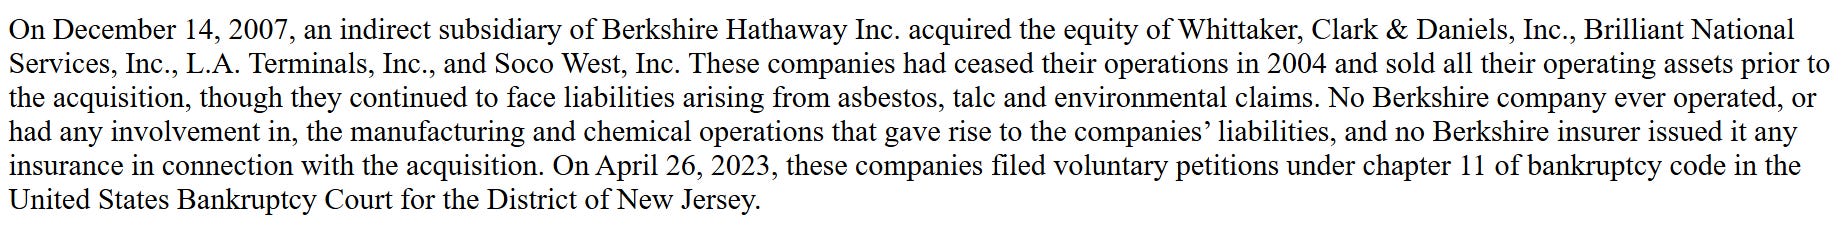
On the negative side of the ledger, Berkshire disclosed a $490 million charge (included as underwriting expenses) related to “a settlement agreement reached concerning certain non-insurance affiliates that filed voluntary petitions under Chapter 11 of the bankruptcy code” in New Jersey. This odd bit of bad news is unusual for Berkshire.
From what I could find online, it relates to asbestos and talc liabilities. Here’s an SEC filing from Berkshire in 2023 related to the matter:
BNSF
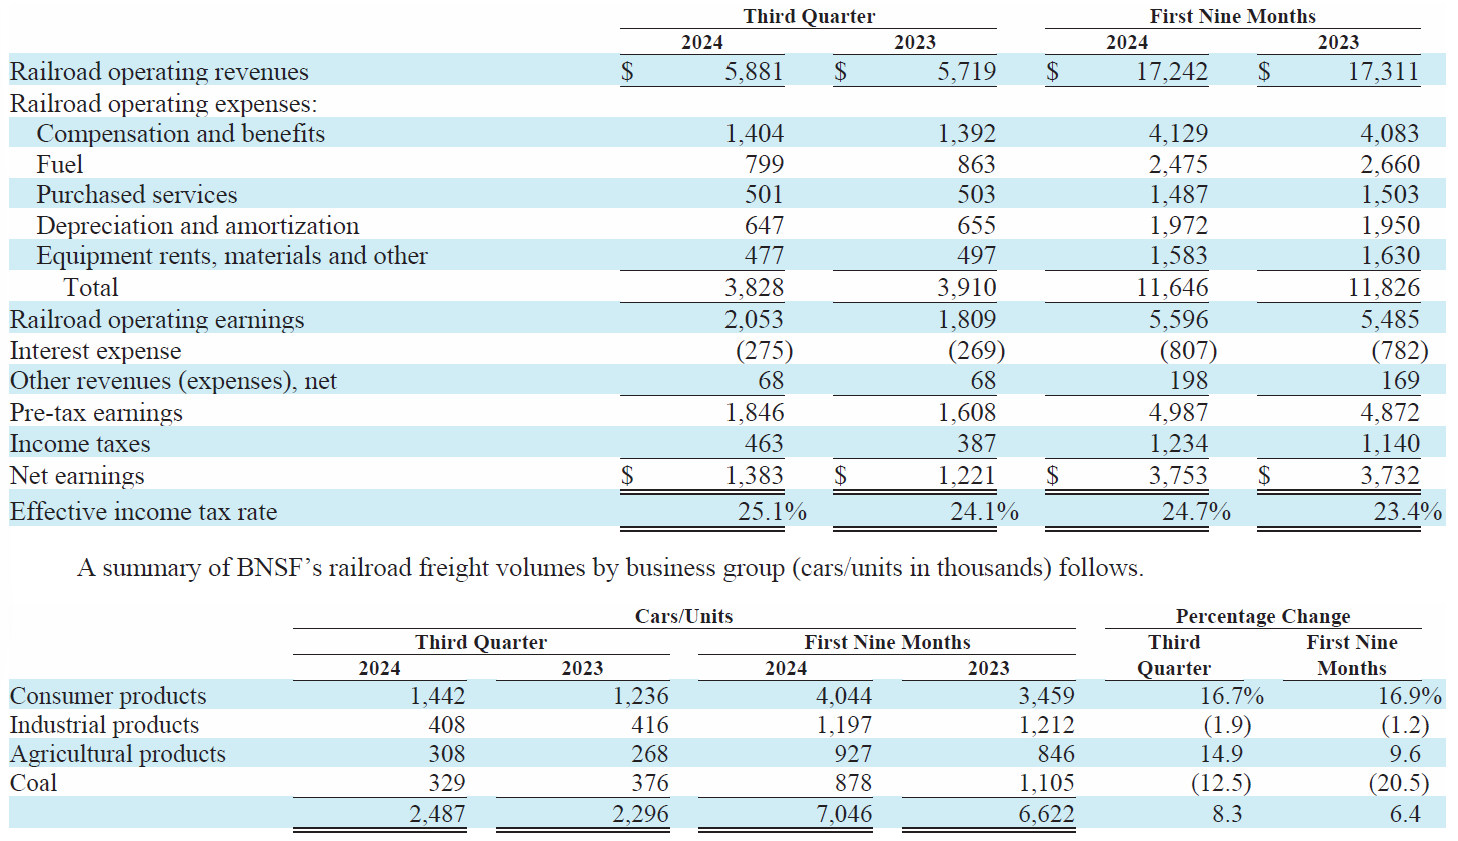
The performance of Berkshire’s rail is getting better but still lags its main rival, Union Pacific. Operating earnings increased 15% compared to the same quarter last year. However, its operating ratio (the ratio of expenses to revenues) was 65% compared to Union Pacific which reported an operating ratio of 60.3% in the third quarter.
BSNF paid Berkshire a $700 million dividend in the third quarter. Year to date it’s paid out 94% of its net income as a dividend. Future gains from BNSF will come from improving its operating ratio to competitive levels and organic growth in the US West Coast. The days of massive growth capex are over.
BRK Energy
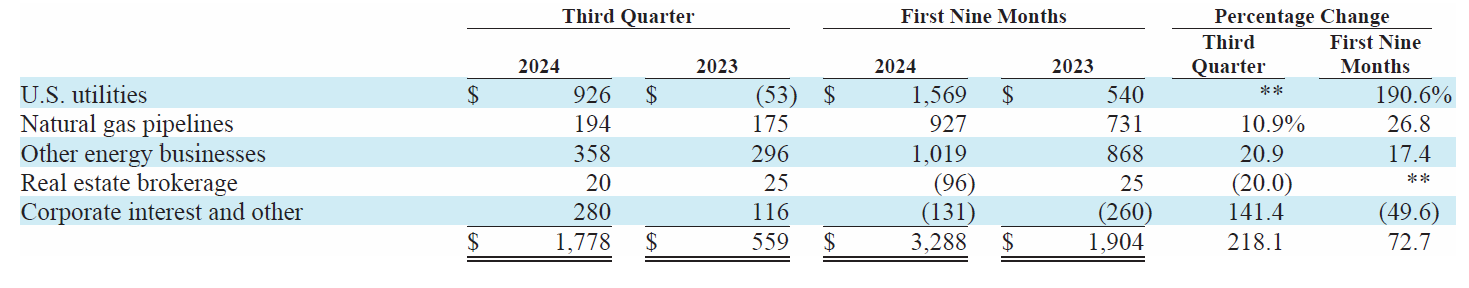
Finally some quiet for BHE, at least on the operating front. We saw no new accruals for wildfire losses, although the outcome of those several lawsuits remains highly uncertain.
The big news at BHE in Q3 was Berkshire increasing its ownership to 100% by buying the holdings once held by the late Walter Scott.
The big news within the big news was the implied purchase price of $49 billion, a whopping 54% discount to the $89 billion value paid for Greg Abel’s shares in 2022. I suspect we’ll hear more about this at the annual meeting in May 2025. It’s clear that the wildfires not only caused a large liability but also exposed Berkshire to the possibility of an unfavorable regulatory climate in certain jurisdictions.
I wrote more extensively about this final piece of BHE in a post at the beginning of October.
Pilot
Pilot’s profits increased 8% compared to the same quarter in 2023 but remain depressed YTD. Results in Q3 may indicate some thawing of the trucking market which has been mired in a 2+ year recession.
Another factor worth considering is Pilot continues to grow. Gross investment in property, plant, and equipment grew by $578 million to nearly $9 billion from year-end 2023 to September 30. Pilot is undergoing a $1 billion modernization program under the leadership of Adam Wright, and should be well-positioned for the inevitable return to normalcy in trucking.
Manufacturing
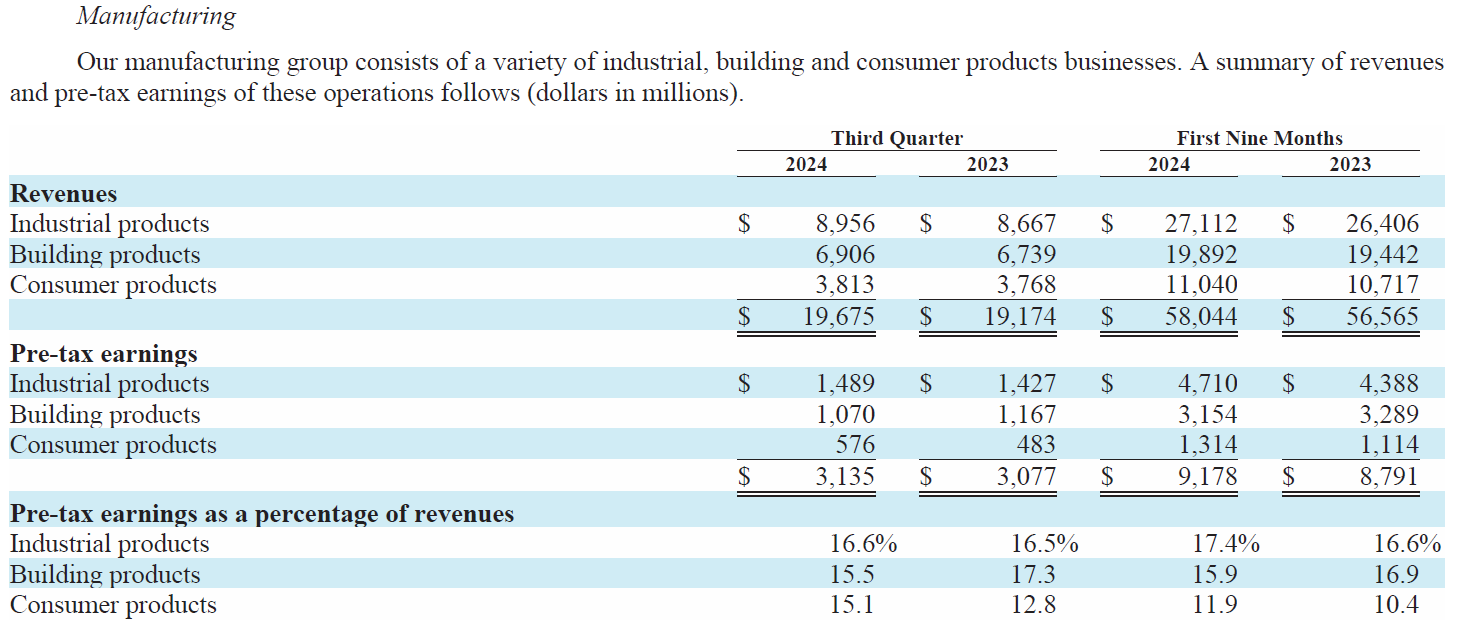
Precision Castparts reported a 12% increase in revenue and a 25% increase in pre-tax profit in Q3 as air travel continues to stoke demand for its products. YTD revenue increased 12% and pre-tax profit by 23%.
Lubrizol reported flat revenues (+3% in Q3, unchanged YTD), but pre-tax profit jumped 36% in Q3 and 45% YTD on higher volumes and lower costs.
Marmon, the largest of the “mini-conglomerates” inside Berkshire with over 100 operating units, reported flat revenues in Q3 and a decline of 3% YTD. Pre-tax earnings declined 13% in Q3 and 9% YTD. Transportation Products, Metal Services, Retail Solutions, Crane Services, and Electrical all reported lower earnings. Rail & Leasing, Water Technologies, and Foodservice Technologies reported higher earnings.
IMC posted slightly lower revenues (down ~1% in Q3 and YTD) and earnings declined 13% in Q3 and 8% YTD. The decline in sales was attributed to weaker economic conditions and geopolitical conflicts. I’m somewhat surprised that IMC, with a large manufacturing base in Israel, hasn’t been impacted to a greater degree.
Building Products saw a 2.5% decline in revenues in Q3 and 2.3% YTD while pre-tax earnings declined 8% in Q3 and 4% YTD.
Again, detail here is important. This segment includes Clayton Homes, which increased revenues nearly 9% in both the quarter and YTD, and saw a 16% decline in pre-tax earnings in the quarter and a decline of 6% YTD which Berkshire says was primarily from lower financial services earnings.
Other building products businesses (Johns Manville, MiTek, Benjamin Moore, Shaw, Acme Brick) held up fairly well with only slightly lower revenues and pre-tax earnings compared to prior periods.
Consumer Products as a whole reported slightly higher revenues (1% in Q3, 3% YTD), and higher earnings (19% in Q3 and 18% YTD). Apparel and footwear (+41%!) and Duracell were the primary contributors, welcome news after many periods of dragging down results of this segment. Pre-tax earnings of Forest River increased 4% YTD.
Service and Retailing
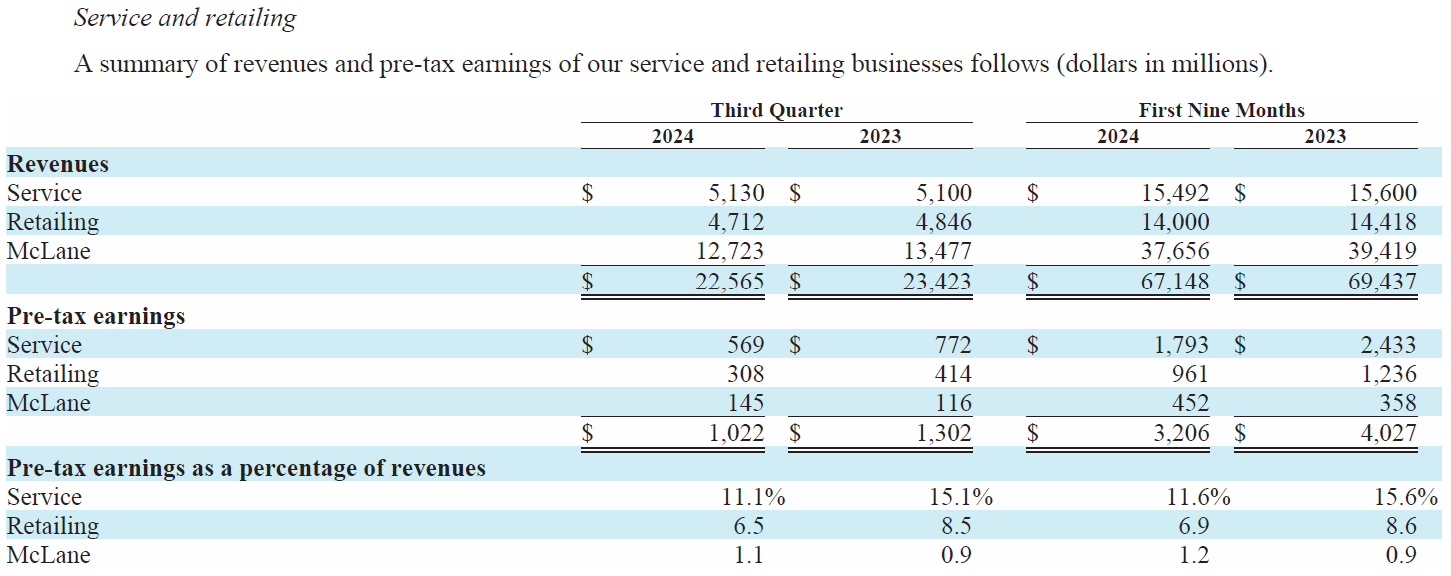
Service businesses reported flat revenues but a decline in pre-tax earnings of 26% in both the quarter and YTD. A big driver was a 48% decline in earnings from TTI, the electronics components distributor. TTI was hit with a multi-front headwind of lower sales, higher competition, and higher expenses.
Aviation services, which encompasses NetJets and FlightSafety, reported a 17.5% decline in pre-tax earnings in the quarter and a 12% decline YTD.
Retailing, dominated by Berkshire Hathaway Automotive at 70% of revenues, reported a 3% decline in both quarterly and YTD revenues. BHA sales declined just 1.4% YTD. Home Furnishing revenues declined 8% YTD, and other service businesses revenues also declined 8%. Pre-tax earnings for retailing declined 26% in Q3 and 22% YTD. BHA pre-tax earnings declined 10% in both periods. Brace yourself: earnings from the rest of retailing dropped 62% in Q3 and 48% YTD. It’s a tough world out there for Berkshire’s retailers right now.
McLane reported a decline in revenues of 6% in the quarter and 5% YTD, with the restaurant business declining 8% YTD. Pre-tax earnings, however, increased 25% in Q3 and 26% YTD from higher margins and lower operating expenses. McLane’s pre-tax margin of 1.1% may look slim but it’s quite high historically.
Updated Valuation
Subscribers have access to the live BRK valuation page on Google Sheets.
I put Berkshire’s value at $936 billion, conservatively estimated, or $434 per B share. If one increases BNSF to what it’s most likely worth long-term the intrinsic value increases to about $950 billion or $440 per B share.
Remember that valuation isn’t a precise exercise. And it’s more akin to a movie than a photograph. Given Berkshire's even larger cash horde, its many businesses with inflation protection, and first-class management, I continue to find shares attractive, if fairly valued.

Stay rational! —Adam
Click here or the image above to apply.


$1.5 billion went out the door in payments. But the economic reality is that Berkshire’s had free use of that capital all this time.